Writing
Three Lenses and a Translator
June 24, 2026
This is part 3 of a 3 part series on data analysis and the changing role of the analyst with LLMs in the mix. Part 1 Part 2
A while back we did an analysis for a beer brand, quantifying the impact Non-Alcoholic(NA) beers have on their current sales. The trend was exactly what was expected and mirrored an industry trend, NA beers are growing rapidly while their siblings are flat or declining.
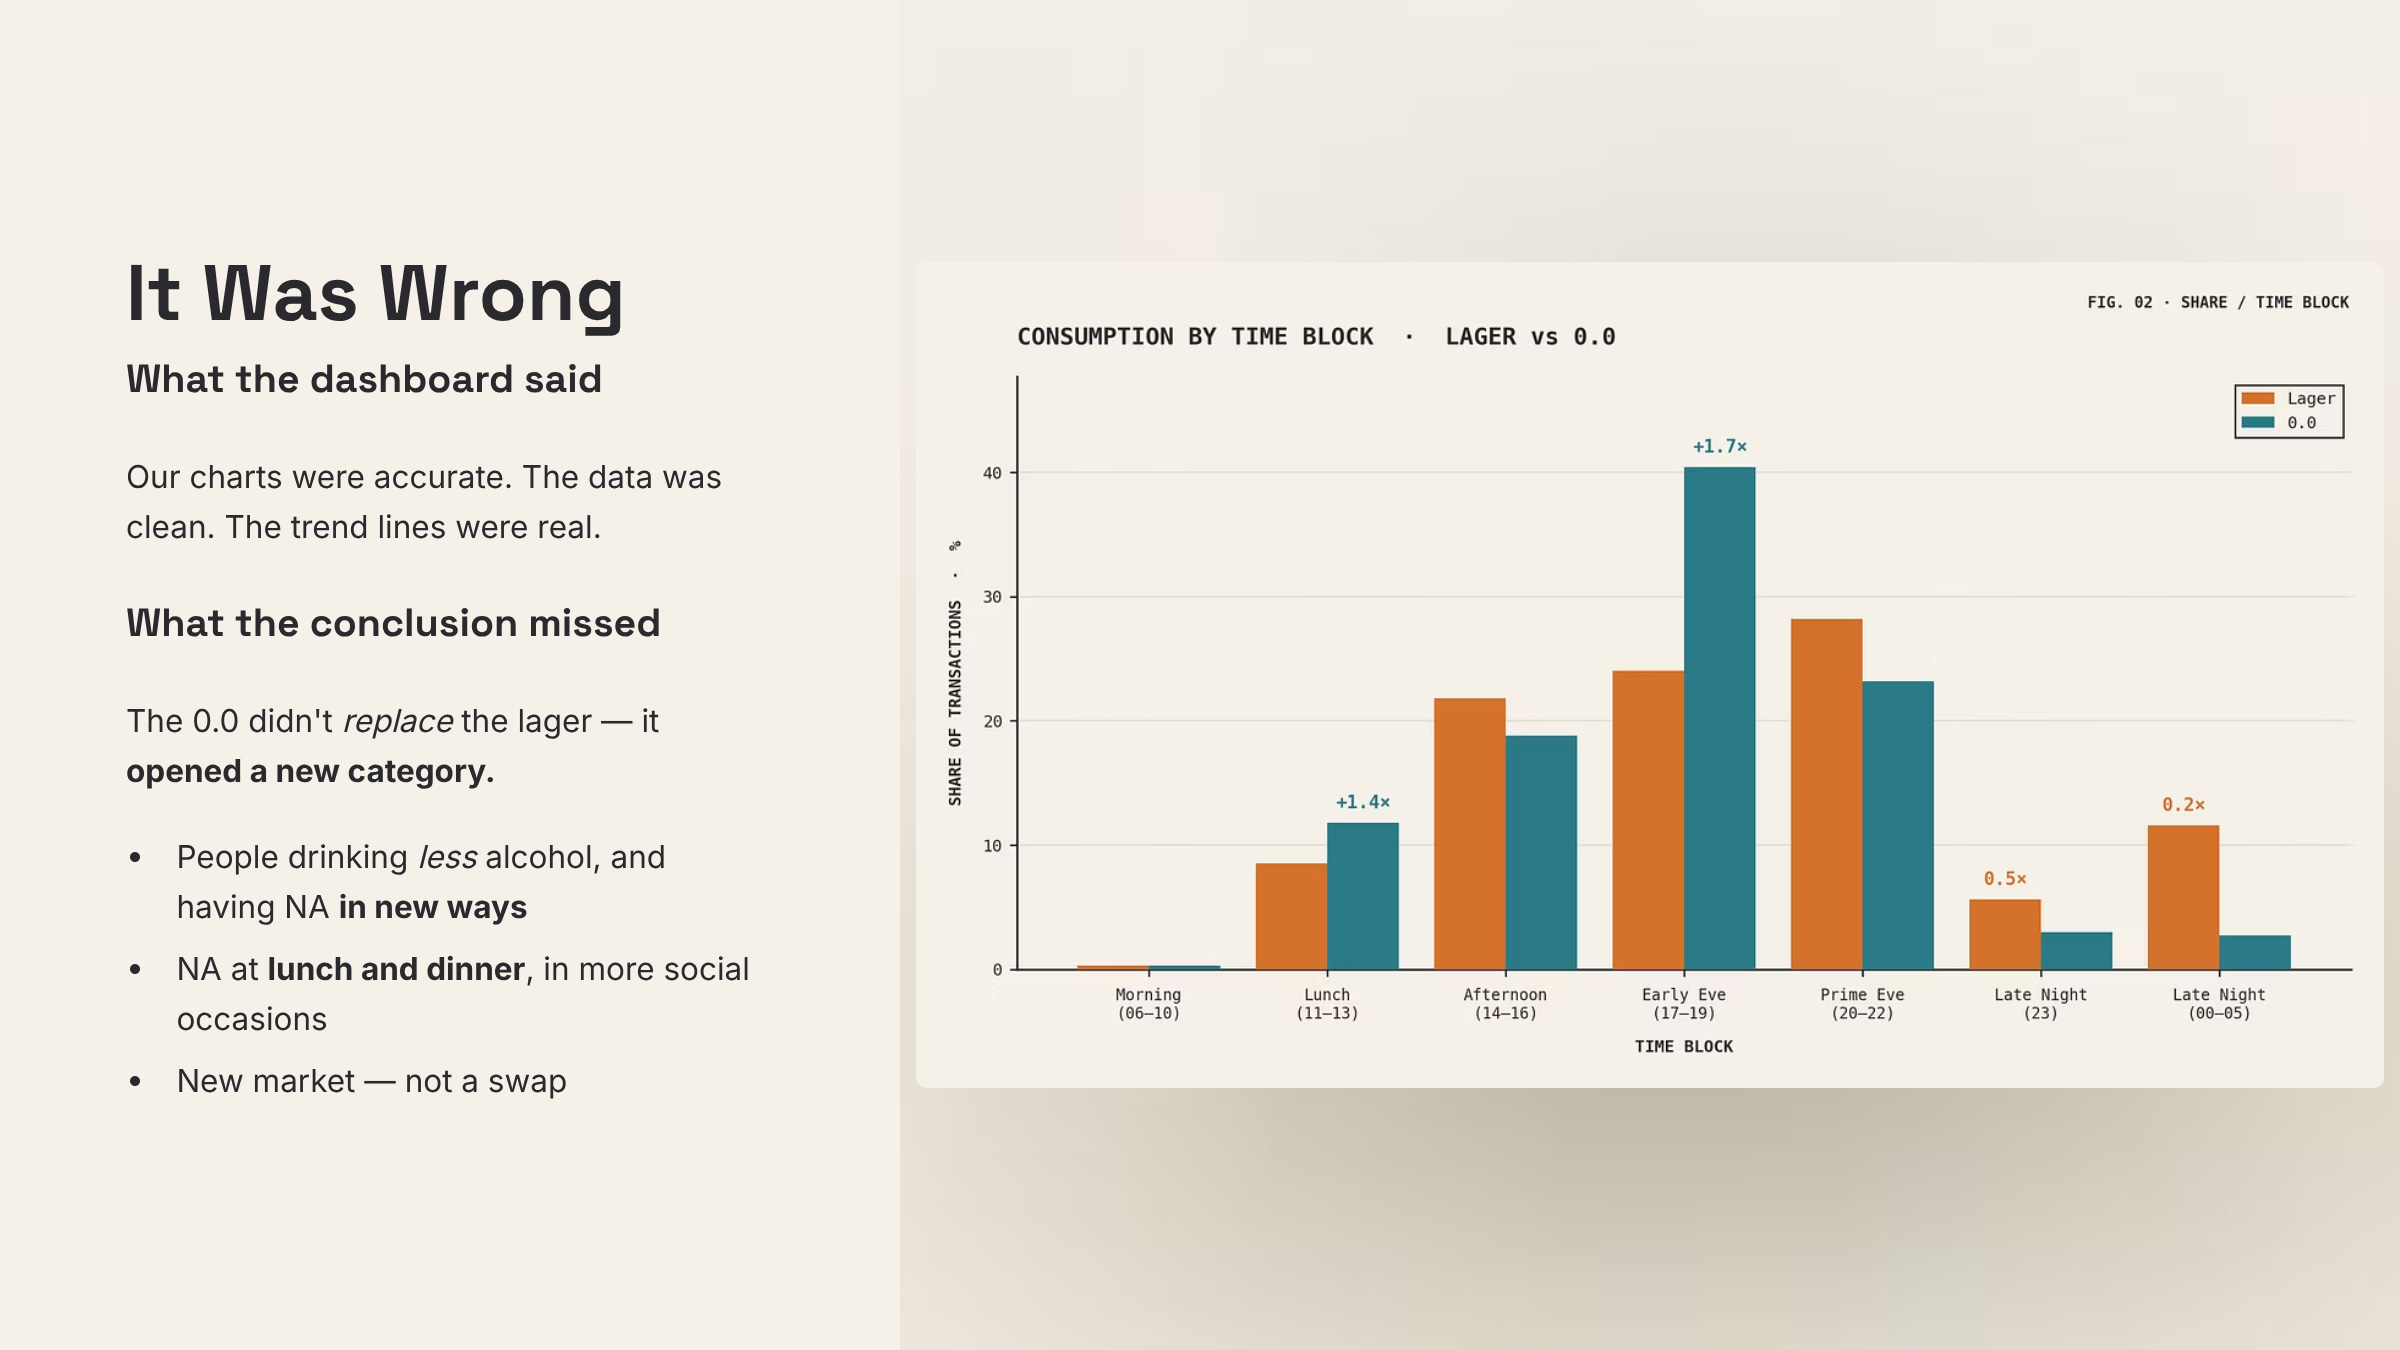
This isn’t new and the dashboards easily picked that out. But digging into the data surfaced that, for this demographic of consumers, they were drinking NA beers during meal times as opposed to the after-work social settings.
They were drinking NA with lunch and dinner, in more social occasions. So instead of cannibalizing the alcohol portion, it introduced a new market.
This drastically changes the marketing approach and effectiveness.
That highlights the changing role of the data analyst. It is no longer sufficient that the analyst provide the dashboards, but take a different approach and provide the actionable results from the data. If your job involves making or looking at dashboards, that role might be short-lived.
So I’m going to present what the new data analyst toolset might look like. I’m going to walk you through the three lenses I run in the understanding layer — vector search, knowledge graphs, and statistical decomposition — plus the translator role that turns their structured findings into language a stakeholder can act on. The beer brand is the worked example through all four.
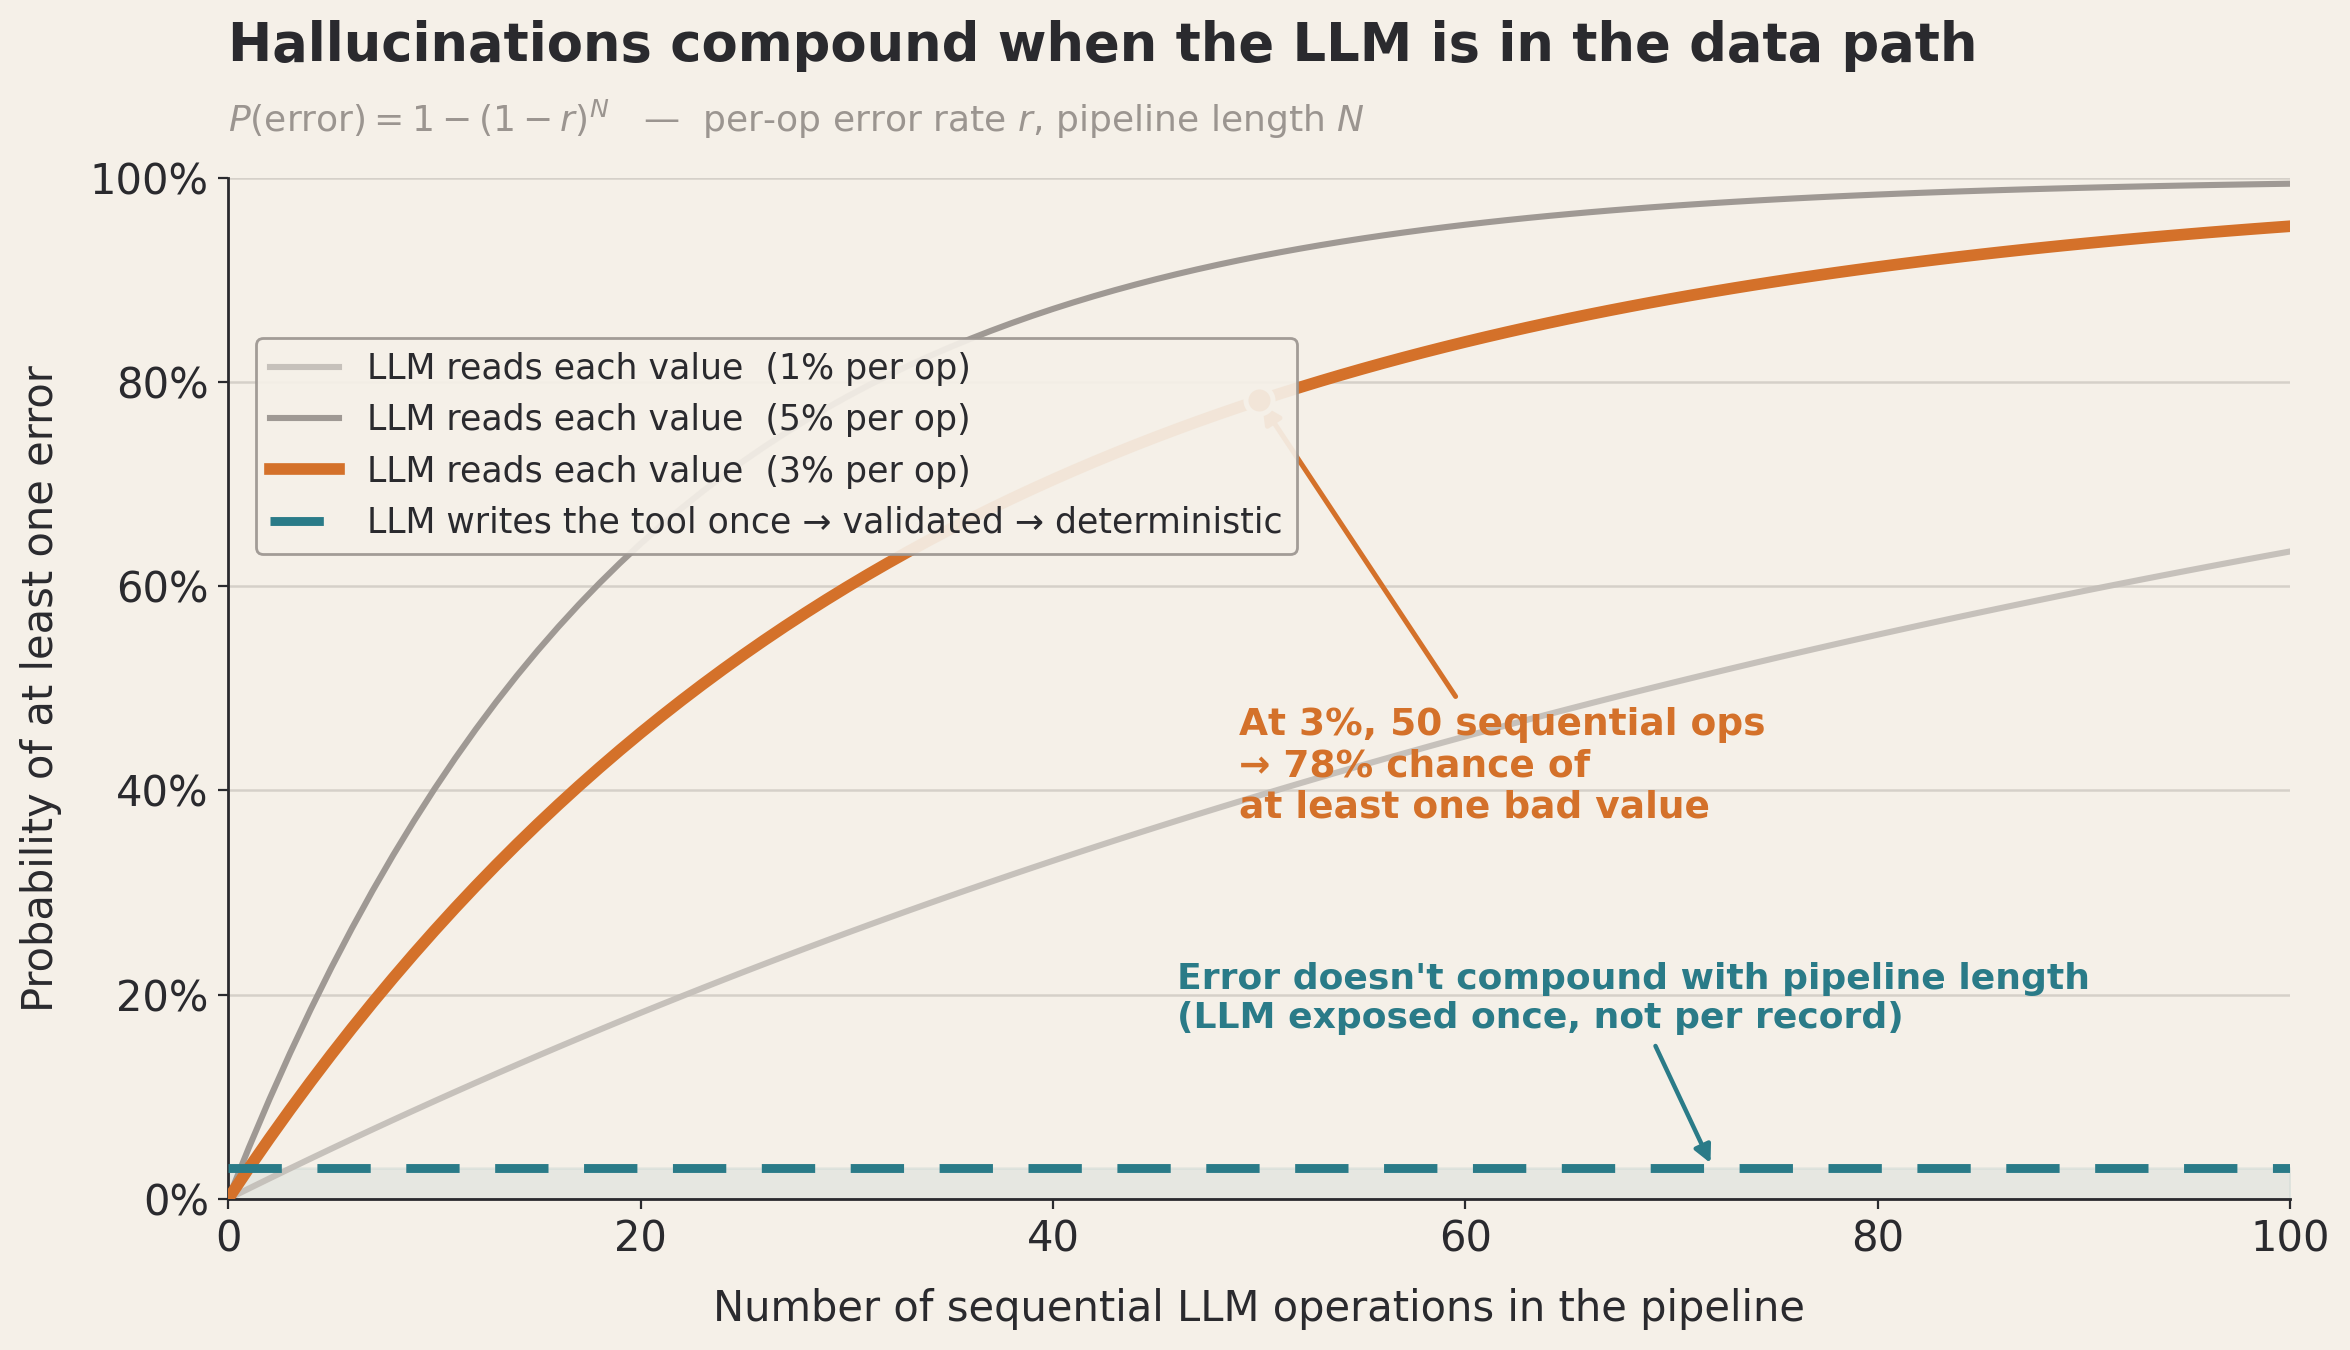
This is the third piece in a series. The first one argued that dashboards are over-applied — they answer the what and the how of your data, but not the why. The second one argued that the obvious fix — drop a language model into the analyst’s seat — is the wrong shape, and the right pattern is LLMs at the edges (orchestrate, synthesize), deterministic tools in the middle, and LLMs as the builders of those tools at design time. This piece is about what the tools actually are.
Three lenses for analysis, one role for translation
I break down the tools into two pieces, Lenses and Roles. Three of them are lenses — primitive ways of looking at data: similarity, structure, statistics. The fourth is a role the synthesizer plays — translating the lens outputs into language. The first three answer different shapes of analytical question. The fourth turns whatever they found into a sentence a VP can act on. I’m going to number all four because they form one architecture, but if your VP is smart you won’t need the last role. Three lenses plus a role. Not four lenses.
Lens 1 — Vectors: the 90% the warehouse never sees
Start with the most under appreciated fact in enterprise data: the warehouse contains a minority of what you know. IDC’s estimate is that roughly 90% of enterprise data is unstructured — and largely invisible to the systems that are supposed to make sense of it. The structured, modeled, warehouse-ready data every dashboard is built on is the tip. Underneath sits the tickets, the call transcripts, the contracts, the product reviews, the email threads. The why lives in the tail.
Finding the right data to do the analysis is key. Search and discovery is probably the most underrated skill a data analyst has in their toolbox, and something the core structure of LLMs are exceedingly good at. The first lens is vector search, the R in RAG based systems.
For vector search you simply calculate a vector embedding for the unstructured text (or image/audio/video), store the vectors somewhere you can query them by similarity. I use pgvector for this most of the time, because keeping the embeddings next to the relational data in Postgres means I’m not babysitting a second system. Now the free-text fields the warehouse couldn’t model are queryable — not by exact keyword, but by meaning. You can ask “what were managers complaining about in the Southwest in March” and get back the notes that are about that, whether or not they used your words.
In practice you don’t want to solely rely on nearest embedding search, you almost always want hybrid retrieval: dense vectors for meaning plus old-fashioned keyword search (BM25) for the cases where the exact term is the point. Pure vector search quietly fails on product codes and proper nouns, and hybrid covers the gap.
What is interesting about vector space where embeddings live, is that similar documents and themes cluster together. If you plot the latent space of an embedded corpus, similar documents cluster — and the clusters themselves are findings.
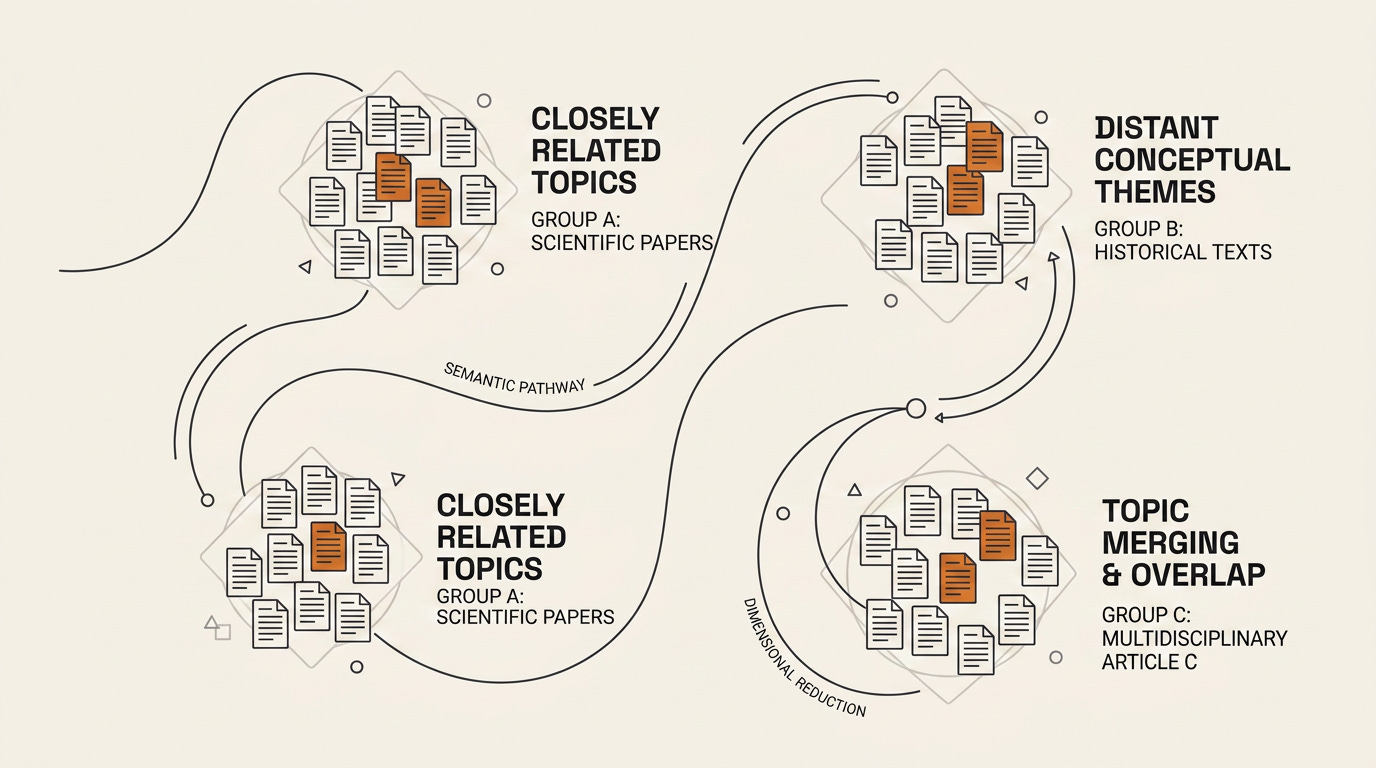
You can see closely related groups huddled together, distant conceptual themes off on their own, and the documents sitting in the overlap between groups, bridging two clusters. That’s not search; it’s a map of what’s in your data, surfaced without you having had to ask. For a corpus you’ve never read end-to-end — a year of support tickets, a quarter of store notes, a decade of contracts — this is often the first useful thing you learn from it.
This is Search (finding exactly what you need) and Discovery (finding patterns in the data) as a key capability for a data analyst and LLMS excels at it.
However, don’t fall under the impression that vector search is all you need. It falls apart on data that isn’t mostly text based. Precise numeric filters. Relational joins. Anything needing a schema. And critically, relationships between things — which is its own lens. Ask it “sum revenue by region where margin fell below 12%” and it will hand you something plausible and wrong, because that’s a structured-query question wearing a natural-language costume. Vector search reaches the 90% the warehouse can’t see. It does not replace the warehouse.
This is the fundamental difference between RAG and vector search, vector search finds the data, RAG extrapolates, sometimes correct - sometimes not.
RAG replaces data analysis the same way googling symptoms on Webmd is going to replace doctors.
Lens 2 — Knowledge graphs: the relationships schemas throw away
The second lens is the one I find most interesting, and I’ll keep it short here because I wrote a whole separate piece on it — Your Notes Already Know More Than You Do — and I don’t want to re-run that argument. Here I only care about why it belongs in the architecture.
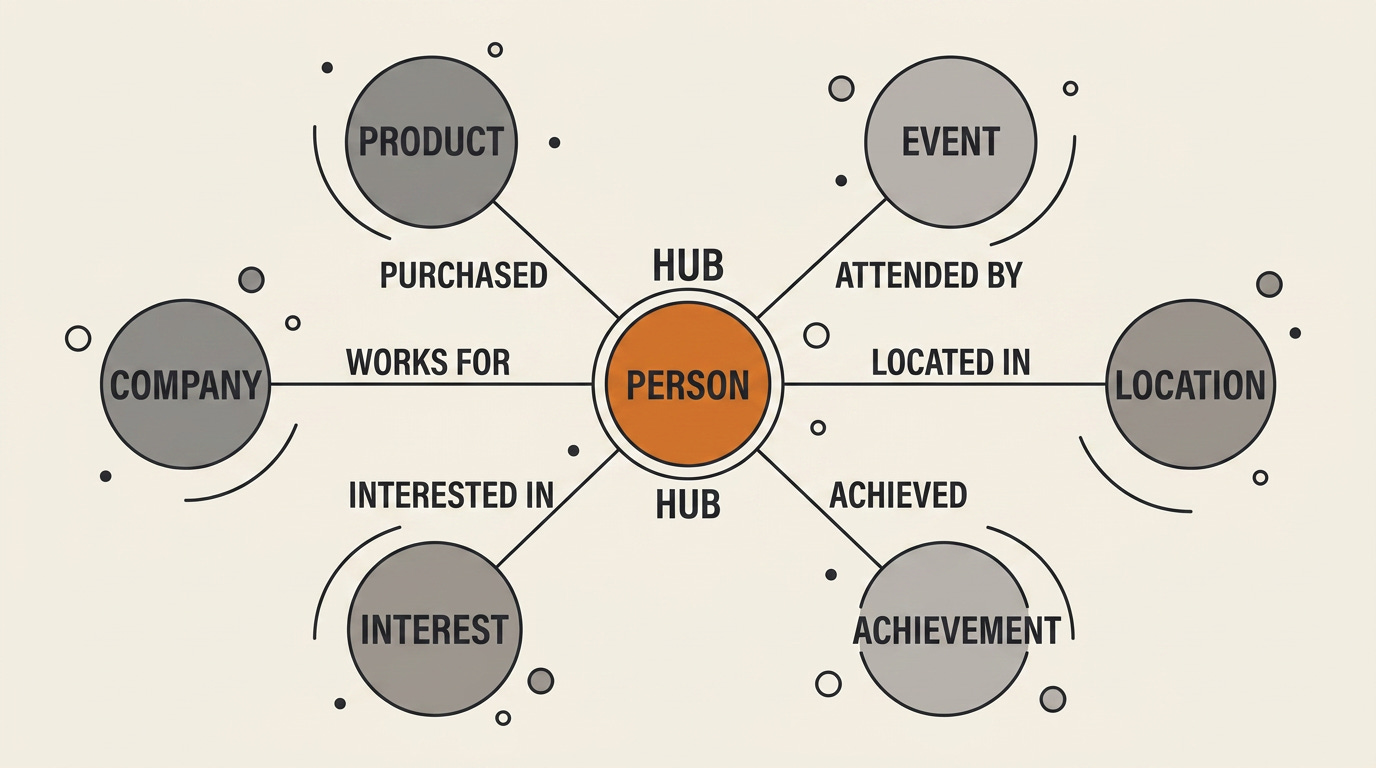
The pitch is this: a schema is a decision about what context to throw away. When you normalize data into tables, you’re committing, upfront, to the relationships you think matter — and discarding the ones you didn’t anticipate. That’s the right trade for a transactional system. It’s the wrong trade when the relationships are the thing you’re trying to discover.
The reason this lens is finally practical is because “knowledge graph” used to mean a six-month consulting engagement and now means an afternoon. The old way: domain experts painstakingly defined the schema, wrote rules for entity extraction, hand-annotated relationships. High-quality, impossible to scale. Each new data source meant new rules. Each new domain meant new experts. The technology was always there; the labor cost was the bottleneck. It was just relational data with extra steps.
LLMs collapsed that cost. They read unstructured text and discover the entities. They infer the relationships. They populate the graph from sources the original schema designer never imagined — meeting notes, contracts, Slack threads, store-manager journals. The schema can evolve as new domains arrive. The build that used to require a team now requires a prompt and a review. And critically: the graph isn’t generated at query time. It’s generated once, by the model, reviewed by you, and then queried deterministically forever after. LLM as the tool-builder again. That’s why this lens belongs in the architecture now and didn’t five years ago.
The composition point that matters for this piece: vectors are for similarity, graphs are for structure. A flat vector search will happily find you two documents that are about the same thing. What it won’t reliably do is follow a chain — this person works at this company, which supplies this region, which had this anomaly. That’s a multi-hop path, and a graph makes it a deterministic walk instead of a lucky retrieval. When the question has a middle link, the graph earns its place. When it just needs the most relevant context, the vectors do. You want both.
I built an open-source tool called kgmd that does the LLM-extraction-over-markdown end of this; the companion piece walks through it.
Lens 3 — Stats: don’t replace the math
The third lens is where most data analysts go wrong, because the dominant narrative right now is that large language models eventually subsume everything, and for time-series and numeric data that narrative is just wrong.
When researchers benchmark LLM forecasters against boring classical methods, the LLMs degrade badly on exactly the data businesses care about most — series with both a trend and a seasonal cycle, which is to say nearly all sales data. Plain old ARIMA and exponential smoothing remain unbeaten on small, regular series. Well-tuned deep learning still wins the hierarchical and probabilistic forecasts. The math we’ve had for decades works well and doesn’t hallucinate. For the statistical structure inside the numbers, it’s still the right tool. Don’t try to make LLMs replace the statistical methods that work. Math = good.
So the move with this lens isn’t to replace the statistics. It’s to wrap them, and to let an LLM build the wrapper. Statistical analysis used to demand deep mathematical understanding plus serious coding chops. LLMs don’t replace the underlying math, but they dramatically lower the cost of applying it: natural-language queries get turned into analysis code that calls the right method, the code goes in your repo, you review it, and from then on it runs deterministically. The LLM is the tool-builder; the tool is reproducible.
Use Claude Code to build your statistical tools, not run your analysis.
Let me make that concrete with the beer brand, because this is where the lenses came together.
The core technique is STL decomposition — Seasonal-Trend decomposition using Loess. It’s not new and it’s not glamorous (I mean it is but for arguments here). You hand it a time series and it splits it into three components: the trend (the slow drift), the seasonal pattern (the repeating cycle), and the residual (everything left over). The first two are the part you could have guessed. The residual is the part you couldn’t — and the residual is where the questions live.
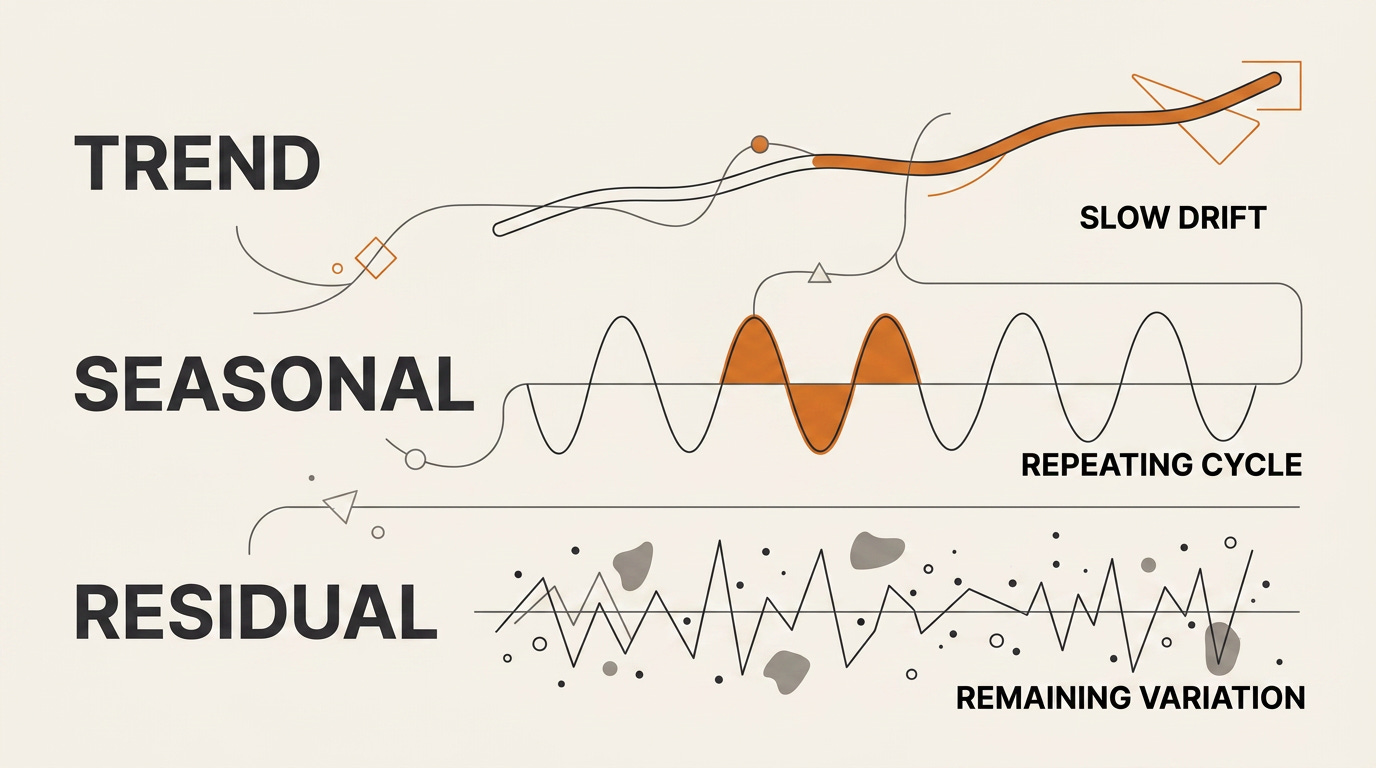
We ran STL on each product’s daily sales without handing the model a calendar — no day-of-week labels, no month labels, just the raw series. The decomposition independently identified the lager’s weekly peak as Saturday and its annual peak as June. For the 0.0, it landed on Friday as the weekly peak and October as the annual one. The math found the structure on its own. Nobody told it that Saturday was the weekend or that summer was beer season. It read that straight out of the numbers.
Then the residual did its job. A spike kept showing up in the 0.0’s October data — more than three standard deviations above what the seasonal baseline predicted, and getting bigger every year. That’s Sober October showing up in restaurant point-of-sale data, a real recurring behaviour the trend-and-season model couldn’t absorb because it wasn’t a smooth seasonal swell; it was a sharp annual event. A dashboard would have shown October as a tall bar. The residual told us October was surprising, which is a completely different and far more useful piece of information.
And then the part that killed the cannibalization story. We ran a lagged correlation between the two products’ residual anomalies and found that the lager’s spikes lead the 0.0’s by about two weeks. That’s not what substitution looks like. Substitution would show the two moving against each other in the same window. A two-week lead looks like event-then-promotion: a big sporting weekend drives the lager, and a couple of weeks later a category promotion lifts the 0.0. The statistics didn’t just describe the data — they falsified the obvious interpretation. That’s the moment the math earned its place in the architecture, because no amount of dashboard staring would have shown that lag, and no amount of LLM eloquence on top of the raw numbers could have produced it either. You needed the decomposition. You needed the correlation. You needed the math.
Lens 4 — Synthesize: the translator role
Lens four isn’t really a lens, but it resolves one of the biggest problems data analysts have in communicating the results to more “action-oriented” business people. What I’ll claim instead is that translation is a role the architecture needs, and the role is load-bearing enough that it deserves a number even if it doesn’t deserve the category.
Here’s what the role does. After the three lenses have done their work — vectors have surfaced the relevant context, the graph has traced the chain, the stats have isolated the residual and falsified the wrong story — you have a pile of structured findings: distances, paths, residuals, anomaly scores, two-week lead values. Nobody runs a business off a residual score. The synthesizer’s job is to take that pile and write the sentence a VP can act on.
For the beer brand, the synthesizer’s output was the sentence nobody had said out loud: these aren’t competing products. The lager is a 10 p.m. Saturday social drink, concentrated in summer. The 0.0 is a 6 p.m. Friday dinner drink — its sales pile up in the early evening, with a real lunchtime presence and weekday strength the lager never has. The 0.0 isn’t taking sales from the lager. It’s opening a new category. Different occasion, different customer, different drink being replaced. That conclusion reframed the entire marketing strategy, and the LLM computed none of it. STL found the structure. Lagged correlation falsified the wrong story. Vectors and the graph supplied the context. The model translated.
This is the LLM’s strong suit. It’s also where the LLM is most likely to embarrass you, and I want to be clear about both at once.
What it’s bad at: hallucination (the synthesizer can produce a confident-sounding conclusion the lens outputs don’t support), overconfidence (it smooths over uncertainty rather than flagging it), prompt sensitivity (small wording changes flip the narrative), and no memory (without grounding it forgets what an earlier lens result said). These aren’t bugs the next model will fix — they’re properties of the medium.
What you do about it is four matching mitigations, and they’re not optional. Grounding: every claim the synthesizer makes traces back to a specific lens result; if there’s no source, there’s no sentence. Transparency: show the math behind the sentence — don’t let the prose hide the residual chart or the path through the graph. Uncertainty: prompt explicitly for confidence intervals and hedged language when the data warrants it; the synthesizer should sound less sure when its inputs are. Human oversight: high-stakes narratives get reviewed, period. An LLM-generated explanation, no matter how eloquent, is only as reliable as the lens outputs it’s grounded in and the scrutiny it gets on the way out.
The motto for this lens, and for the whole architecture, is the one from the stats section: don’t replace the math. Wrap it. The synthesizer wraps the math in language. It doesn’t compute. It translates.
What’s left to figure out
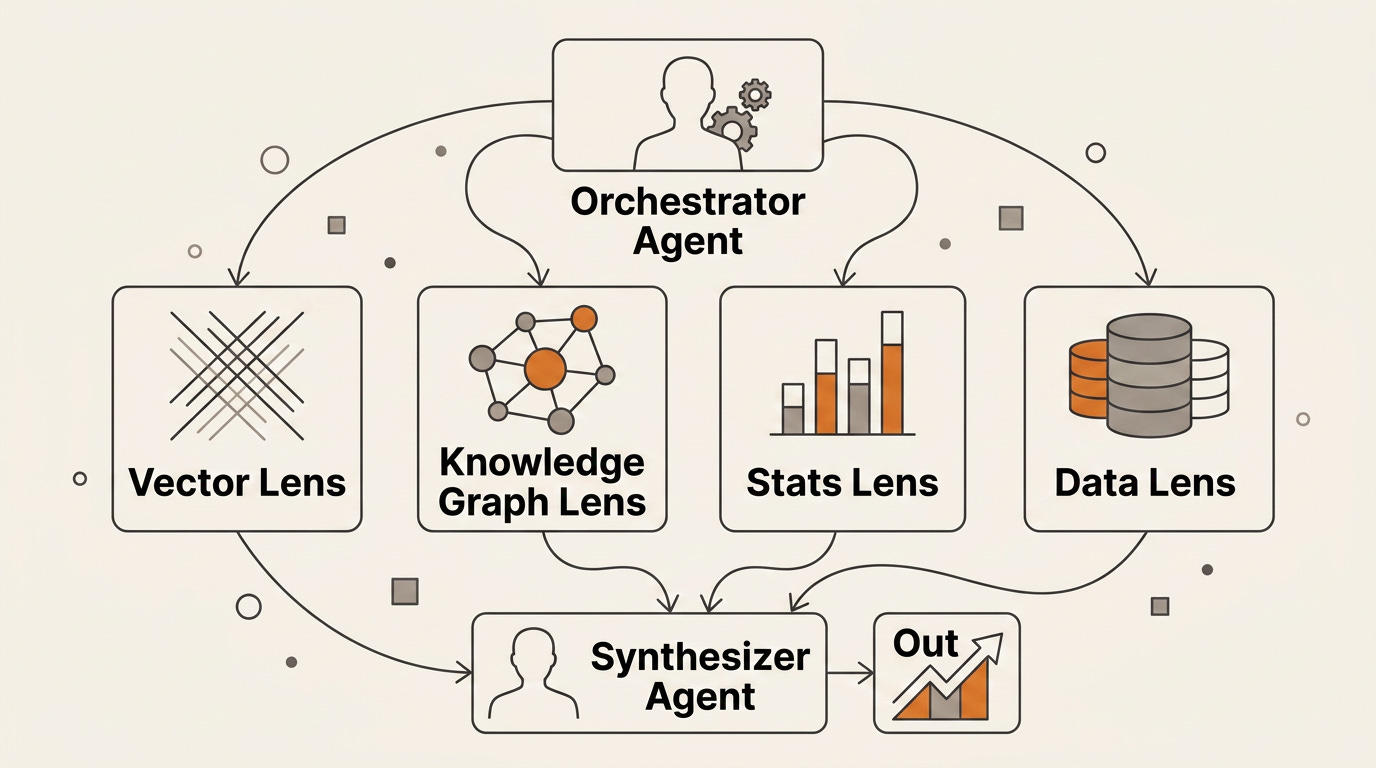
I’m still working through where the edges of this pattern are. How thin can the orchestrator’s routing logic be before mis-routing becomes the new silent failure. How confident can a synthesizer be allowed to sound when its lens inputs disagree. Whether the two-agent split is worth the operational cost below a certain scale, or whether most teams should live with one agent doing both jobs. Whether the LLM-as-tool-builder pattern holds for analytics specifically, or whether it generalizes to every part of the data stack. If you’ve built something in this shape — or you’ve hit the seams I haven’t — I’d genuinely like to hear about it.
One closing thought is that the consumer of this layer might not be a human much longer. Once understanding is something software produces rather than something a person extracts by looking, the natural next reader is another agent — one that subscribes to your residual anomalies the way you used to subscribe to a weekly report, and acts on them before anyone opens a tab. We built dashboards for human eyes. We may be building the understanding layer for something else entirely. Maybe we need an article on the changing roles of VPs?
Originally published on Discontinuity